- Quickstarts
- Prometheus
Deploy Prometheus on Render
Prometheus is a popular open-source monitoring system that records real-time service metrics to a time-series database. You can query Prometheus directly or visualize your metrics with a tool like Grafana.
This quickstart walks through deploying Prometheus on Render so you can scrape metrics from your other running services.
Prometheus cannot run on a free Render instance, because it requires an attached persistent disk to retain metrics data.
1. Initial deploy
-
Create a new repo from the
render-examples/prometheusGitHub template.- Alternatively, you can clone the repo and push your clone to GitLab or Bitbucket.
-
In the Render Dashboard, click New > Web Service and connect your new repo.
-
Set the service’s Runtime to Docker.
- Render deploys your Prometheus instance as a Docker container based on the official Prometheus image.
-
Select any instance type except Free.
- Prometheus requires an attached persistent disk, which is not supported for free instances.
-
Under Advanced, add a disk to your service with the following values:
Name prometheus-diskMount Path /var/dataSize 1 GB(You can increase this later as needed.) -
Click Create Web Service to kick off your first deploy!
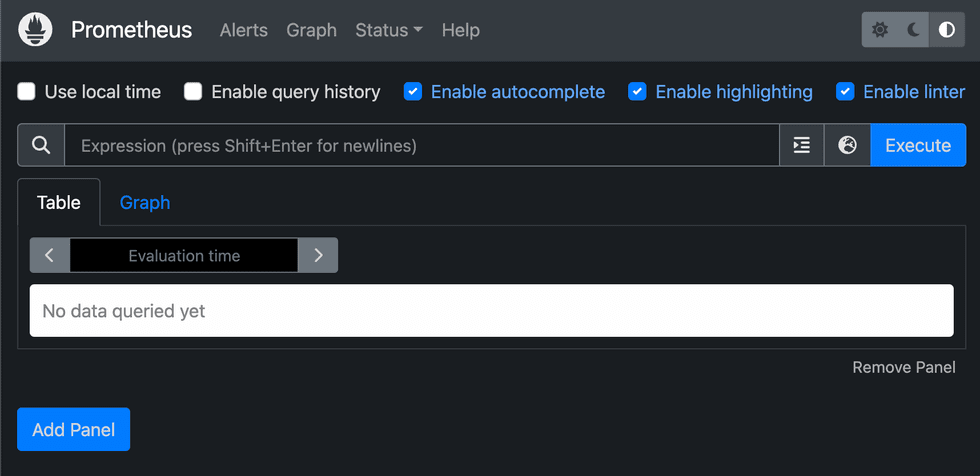
When your deploy completes, visit your service’s onrender.com URL to open your Prometheus dashboard:

Your Prometheus dashboard is currently accessible to anyone with its URL.
- To secure your dashboard with basic auth, follow the steps in the Prometheus documentation.
- If you don’t need to access your dashboard, you can deploy Prometheus as a private service instead of a web service.
Your Prometheus instance is already configured to scrape metrics from itself. Try executing this simple expression to view some initial data:
prometheus_http_requests_totalNow that Prometheus is up and running, let’s configure it to scrape metrics from your other services.
2. Configuring metrics scraping
Prometheus can communicate over your private network to scrape metrics from your other Render web services and private services running in the same region. To set this up, modify the prometheus.yml file in your repo’s root. The file looks like this to start:
+ Click to show
global:
  scrape_interval: 15s # By default, scrape targets every 15 seconds.

# Configuration for scraping individual services
scrape_configs:

  # Configuration for scraping Prometheus itself
  - job_name: 'prometheus'
    dns_sd_configs:
      - names: ['RENDER_SERVICE_NAME-discovery']
        port: 9090
        type: A # Render service discovery uses A records
        refresh_interval: 5s # Refresh the list of targets every 5 seconds

  # Uncomment to add a job for scraping another Render service
  # - job_name: 'REPLACE_ME' # Replace w/ your service's name
  #   dns_sd_configs:
  #     - names: ['REPLACE_ME-discovery'] # Replace w/ your service's internal hostname + '-discovery'
  #       port: REPLACE_ME # Replace w/ the port for your service's metrics endpoint
  #       type: A
  #       refresh_interval: 5s
The single defined job (prometheus) configures Prometheus to scrape metrics from itself.
To scrape metrics from one of your other Render services, uncomment the second block under scrape_configs and customize the following values:
| Field | Description |
|---|---|
|
A unique name for the job. For clarity, we recommend using the name of the service you’re scraping. |
|
An array containing a single string, which is the target service’s discovery hostname. This string has the format Prometheus uses the discovery hostname to obtain the IP address for each running instance of the target service. This ensures that you scrape metrics from all instances if you scale a service. Note that the predefined |
|
The port on which the service exposes its metrics endpoint. |
|
This value is always |
|
How often Prometheus should refresh the list of targets. |
|
The path of the target service’s metrics endpoint. The default value is |
Here’s an example configuration for scraping metrics from a service with internal hostname my-api-sr2m running on port 4000:
scrape_configs:

  # ...other jobs...

- job_name: 'my-api'
    dns_sd_configs:
      - names: ['my-api-sr2m-discovery']
        port: 4000
        type: A
        refresh_interval: 5s
For more on configuring prometheus.yml, see the Prometheus documentation.
For more on how to build an endpoint for Prometheus to scrape, see the Prometheus data model documentation.
## Next stepsVisualizing metrics with Grafana
If you’re running Grafana on Render, you can create dashboards to visualize your Prometheus data.
Follow the steps in Grafana’s Configure Prometheus guide. For the data source URL, provide your Prometheus service’s internal hostname and port, such as http://my-prometheus-service:9090.