Logs in the Render Dashboard
Use Render’s log explorer to view and search recent logs generated by your service. The explorer is available from your service’s Logs page in the Render Dashboard:
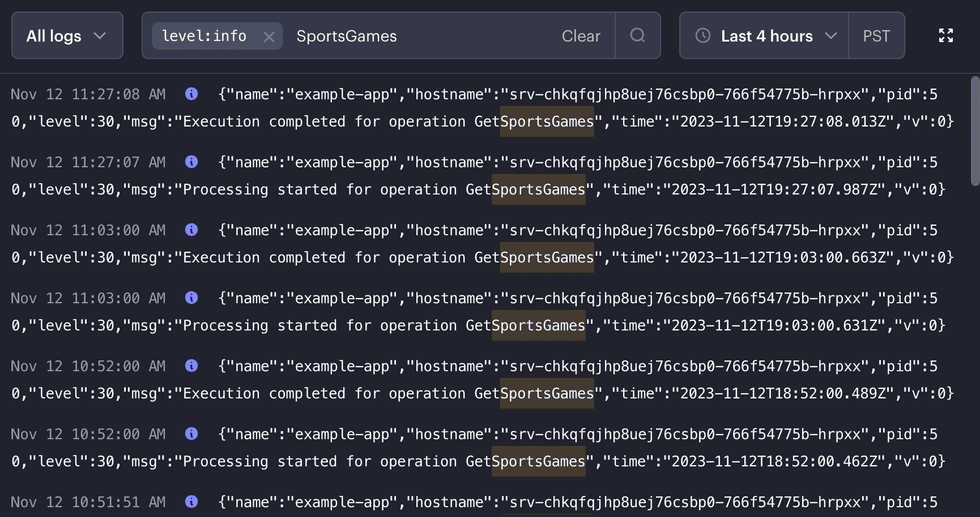
In addition to searching for a particular string, you can filter by details like log level and time range.
When you identify a log line of interest, mouse over it and click View in context to jump to its original location:
If you have a Professional workspace or higher, the explorer also displays HTTP request logs for your web services.
Separately, you can view logs for any recent deploy or one-off job.
Render does not emit logs for static sites.
Log filters
When searching with the log explorer, you can filter results by the following (in addition to searching for an arbitrary string):
| Filter | Description |
|---|---|
| Time range |
You can limit results to a predefined range (such as Last 24 hours), specify a custom range, or select Live tail to view a live feed of recent logs. Available ranges depend on your workspace’s log retention period. Specify using the dropdown in the upper right of the log explorer. |
|
|
The log level, such as Specify in the search box. |
|
|
HTTP request logs only. The HTTP method of a particular request (such as Specify in the search box. |
|
|
HTTP request logs only. The response code for a particular request (such as Specify in the search box. |
|
|
HTTP request logs only. The originating domain of a particular request (such as Specify in the search box. |
Wildcards and regular expressions
The log explorer supports searching with wildcards and regular expressions.
To match any number of characters, use the wildcard token (*). To match against a regular expression, enclose your search in forward slashes (/). You can then use any metacharacters supported by the RE2 syntax.
You can use wildcards and regular expressions in search strings and in filters. See the table below for some useful examples.
| Search | Description |
|---|---|
|
|
Returns logs that contain |
|
|
Returns logs that contain |
|
|
Returns logs that contain |
|
|
Returns request logs with a |
|
|
Returns request logs with a |
|
|
Returns request logs with a path that starts with |
|
| Returns request logs with a response time greater than one second. |
Keyboard shortcuts
The log explorer supports these keyboard shortcuts:
| Action | Shortcut |
|---|---|
| Focus search bar | / |
| Enable fullscreen | m |
| Exit fullscreen | m or Esc |
| Scroll (slow) | Arrow Up / Arrow Down |
| Scroll (fast) | Page Up / Page Down |
| Jump to top | Home |
| Jump to bottom | End |
HTTP request logs
If you have a Professional workspace or higher, Render generates a log entry for each HTTP request to your team’s web services from the public internet:
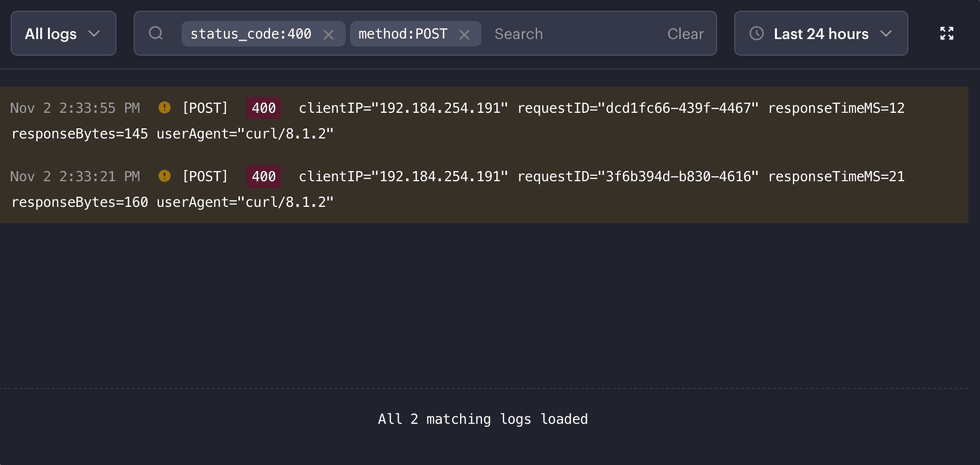
This helps you debug unexpected behavior for a request, in particular by tracing its execution via the requestID field.
HTTP request logs appear alongside application logs in the explorer, and they support additional filters (such as method and status_code).
Render does not generate request logs for HTTP requests sent from other services over your private network—only for requests sent to web services over the public internet.
Tracing with requestID and Rndr-Id
In each HTTP request log entry, the value of the requestID field uniquely identifies the associated request:
Nov 2 2:47:04 PM [GET] 400 clientIP="34.105.23.229" requestID="542c7b8b-c833-4b3c" ...Render includes this same value in the Rndr-Id HTTP header—both in the request to your web service and in the response to the requesting client:
Rndr-Id: 542c7b8b-c833-4b3cIn your web service’s code, you can extract this value from the header and include it in every log you generate for a given request. If you do, you can search for this ID in the log explorer to view the corresponding request’s chronological log history.
On the client’s side, here’s what a Rndr-Id looks like in Chrome’s Network panel:
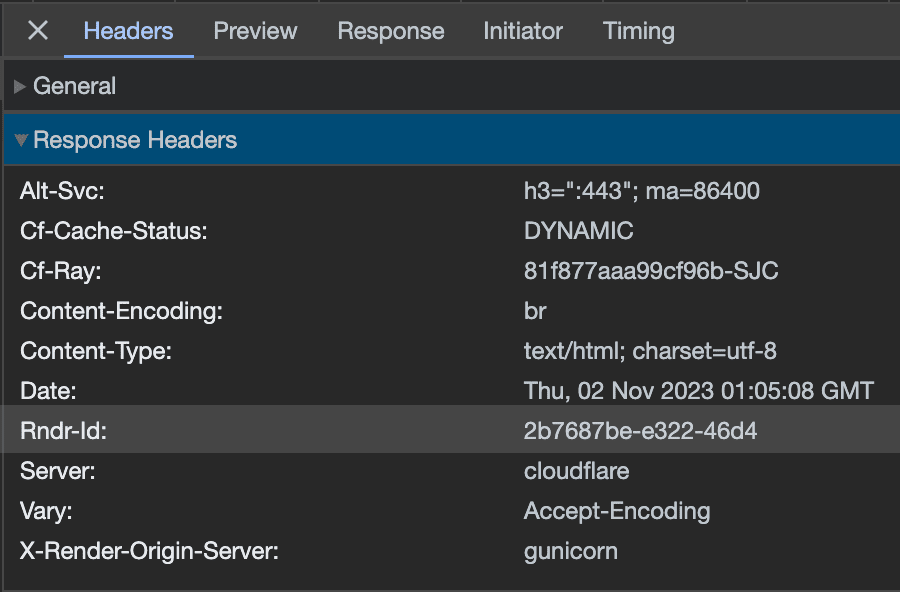
By tracing each phase of the request lifecycle with one consistent ID, you can more quickly diagnose and debug issues in collaboration with the users who encounter them.
Logs for an individual deploy or job
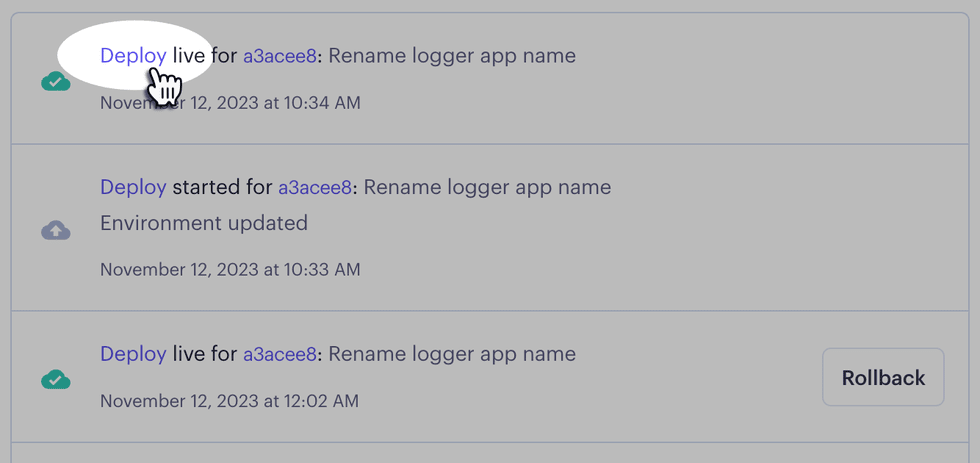
View the logs for an individual deploy of your service from the service’s Events page. Click the word Deploy in a timeline entry to open the log viewer:
⬇️
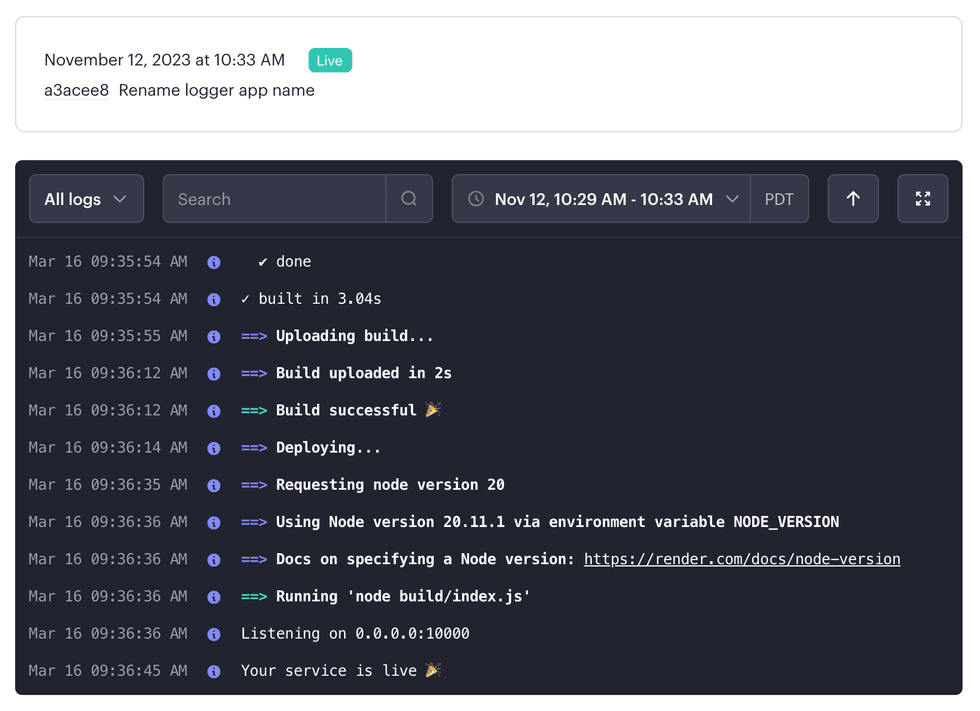
Similarly, you can view logs for the execution of a one-off job from the associated service’s Jobs page.
Log limits
Retention period
Render’s log retention period depends on your workspace’s plan (see the pricing page):
| Workspace Plan | Retention Period |
|---|---|
| Hobby | 7 days |
| Professional | 14 days |
| Organization / Enterprise | 30 days |
Logs older than your current rentention period are no longer available, even if you upgrade your plan to extend the period.
If you need to retain logs for a longer period, you can stream your logs to a syslog-compatible provider.
Rate limit
Render processes a maximum of 6,000 application-generated log lines per minute for each running instance of a service.
If an instance generates logs in excess of this limit, Render drops the excess log lines. Dropped log lines don’t appear in the log explorer or in log streams.